Changelog
Put a chart or a single number on any page
- Dashboard
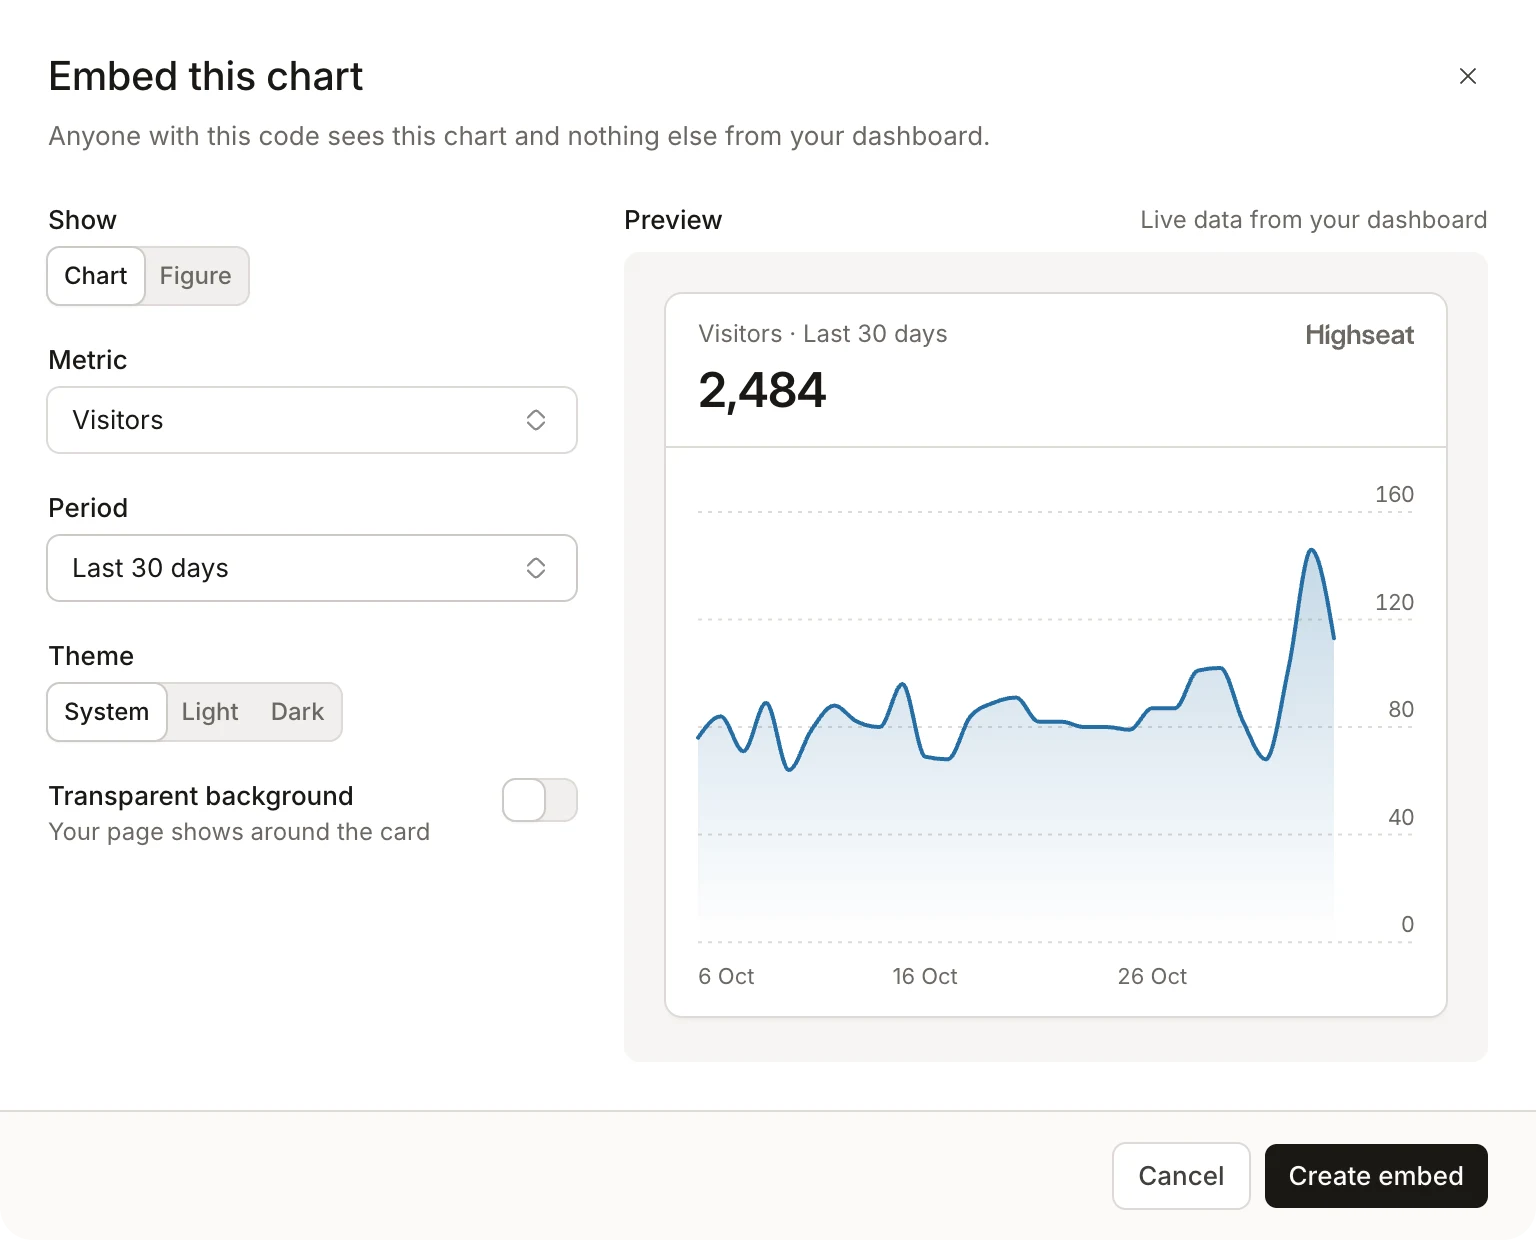
Show your traffic on your own site: a public stats page, an advertise page, a line in your footer. Click Embed… in the dashboard's toolbar, pick the main chart or a single figure, choose the metric and the period, and copy the code. A figure can be visitors, views, revenue or who's online now.
The card reads live data and fits itself to your page, in light or dark. Last 30 days stays the last 30 days, so it moves with the calendar and matches your dashboard.
Each embed has its own link, and that link shows the one chart or figure you picked. Anyone reading your page's source gets that card and nothing else from your dashboard. Filters you've set carry over, so a chart can show one country or one campaign.
Your embeds are listed in a site's Sharing settings. Delete one and it disappears from every page that shows it. The embed guide has the details.
Improvements
- A dashboard embedded from a share link now sizes its frame to fit, so your page shows no second scrollbar and no empty space.
- Embeds take a transparent background, so your page's own colour shows through.